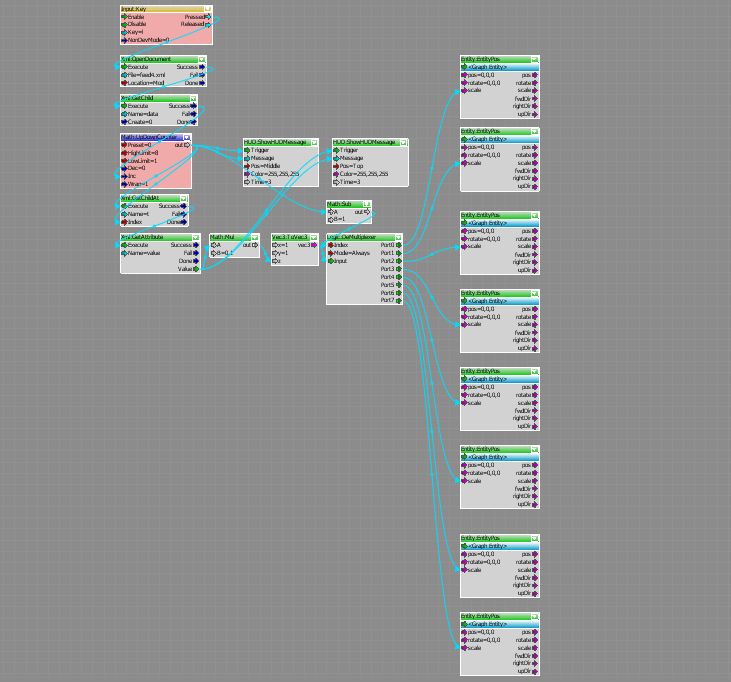
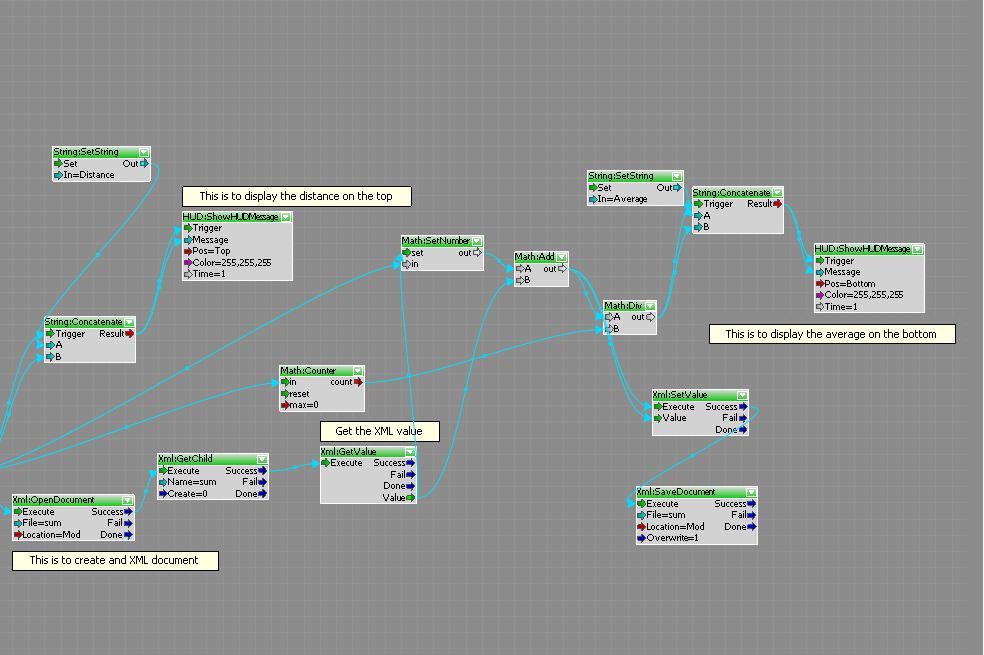
Flow graphs that read the XML file and will present thought bar graphs in building forms.
Brief
The idea of the Analytics engine is to present the temperature of different countries through bar graph in order to show the different between them. The buildings in three different areas represent a rural areas, developed countries and developing countries.
As the pachube that I have chosen was a brief one which I can determine it from myself and can have more freedom to decide the own purpose. As the building goes taller, that means that the temperature is higher.
In the bar of developing countries, the building is getting taller and taller or it has just remained the same which would like to bring out the concept that the heat is trapped in the city as the buildings do not allow the heat to be released. Therefore, it indicates that the solar panel that can help the decrease and release the heat of the city.
3x 30 sec video
Tutorial

Research assignment
Tutorial description:The tutorial I have chosen is to have an automatic door in Crysis, although this looks simple but this would be complicated if you do not get the flow graph working.
The doors will work as the local player walk towards the door and gets closer, the doors will automatically open.
From exp 1 & 2, i found out that no matter how easy the flow graph is, if you do not get it work or you have made one mistake in a node, it will be very frustrated and it will be very hard to spot them out if you do not check them one by one. So I have decided to interpret some simple flow graph but it will also helps the people to figure a lot of other flow graphs out as well as changing some minor node to have different result.
I got this inspiration from Vinh's tutorial which I think that having an automatic door will help the building to be much more modern and idealise while I demonstrate to others.
I did a research on automatic doors which nowadays, there are lots of different types of doors, such as the most used one which two doors go to the side, then the rotation one which you will get a better chance to see them in hotels, lastly, the door that you would see in movies in the space craft that it is combined with three triangles and it will rotate when you walk closer.
I have first made sure that my idea works with the flow graph, so I have tested with a box which allows myself to find out the result immediately. Then I used google sketch up to draw a door frame and doors so I can import into Crysis sandbox and start my tutorial video recording.
I really enjoyed doing this tutorial as I can share with people so we can learn from each other. The difficult part was recording my speaking as I found it hard to explain to others.
I hope people will enjoy my tutorial and find it useful as they are viewing it.
sketch up: http://sketchup.google.com/3dwarehouse/details?mid=f6f2e477eeacc7422c889d3b16e97dbf&prevstart=0
mediafile:http://www.mediafire.com/?7144bmjjx3y8yxx
mediafile:http://www.mediafire.com/?7144bmjjx3y8yxx


